ACLS Training Dashboard
ACLS Training Dashboard
Year
Sept '23 - Dec '23
Project
SI 582: Introduction to Interaction Design
Tools
Figma, FigJam, Adobe Photoshop, Canva
My Role
Interaction Designer
Interaction Designer
The Team
Aleena Qaiser: Ideation and prototyping
Jinnan Chen: Research and prototyping
David Cox: Brainstorming & Research
Vivian Gao: Research
Aleena Qaiser: Ideation and prototyping
Jinnan Chen: Research and prototyping
David Cox: Brainstorming & Research
Vivian Gao: Research
The Client
Michigan Medicine
Michigan Medicine
Type of Work
UX Research
User flows
Wireframing & Prototyping
Usability Testing
UX Research
User flows
Wireframing & Prototyping
Usability Testing
As part of a master’s-level course, our team worked on improving ACLS VR training debriefing sessions at Michigan Medicine. We focused on simplifying the process for both trainees and instructors, using a user-centered approach and a robust feedback system to enhance learning and support continuous improvement.
As part of a master’s-level course, our team worked on improving ACLS VR training debriefing sessions at Michigan Medicine. We focused on simplifying the process for both trainees and instructors, using a user-centered approach and a robust feedback system to enhance learning and support continuous improvement.
The Challenge
The Challenge
Keep track of all training sessions
Keep track of all training sessions
A need for enhanced feedback system
A need for enhanced feedback system
The Context
The Context
Medical trainees complete a 15-minute VR training in the simulation room, followed by a 5–10 minute debrief, where instructors review session recordings and provide feedback.
Medical trainees complete a 15-minute VR training in the simulation room, followed by a 5–10 minute debrief, where instructors review session recordings and provide feedback.
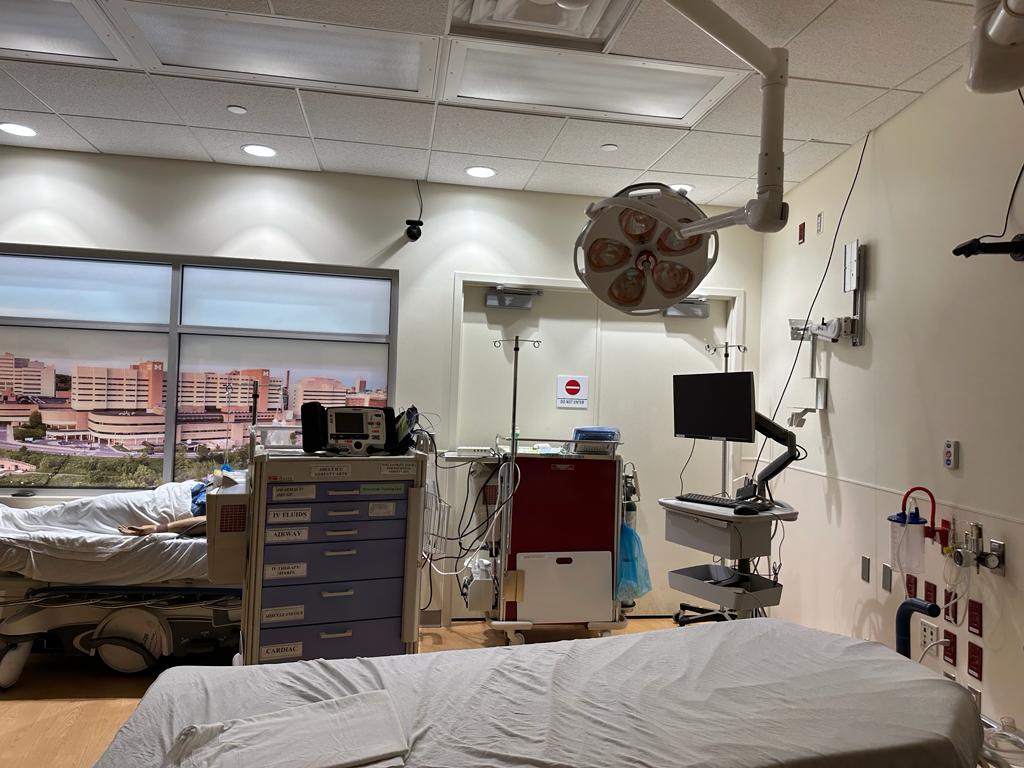
Simulation Room
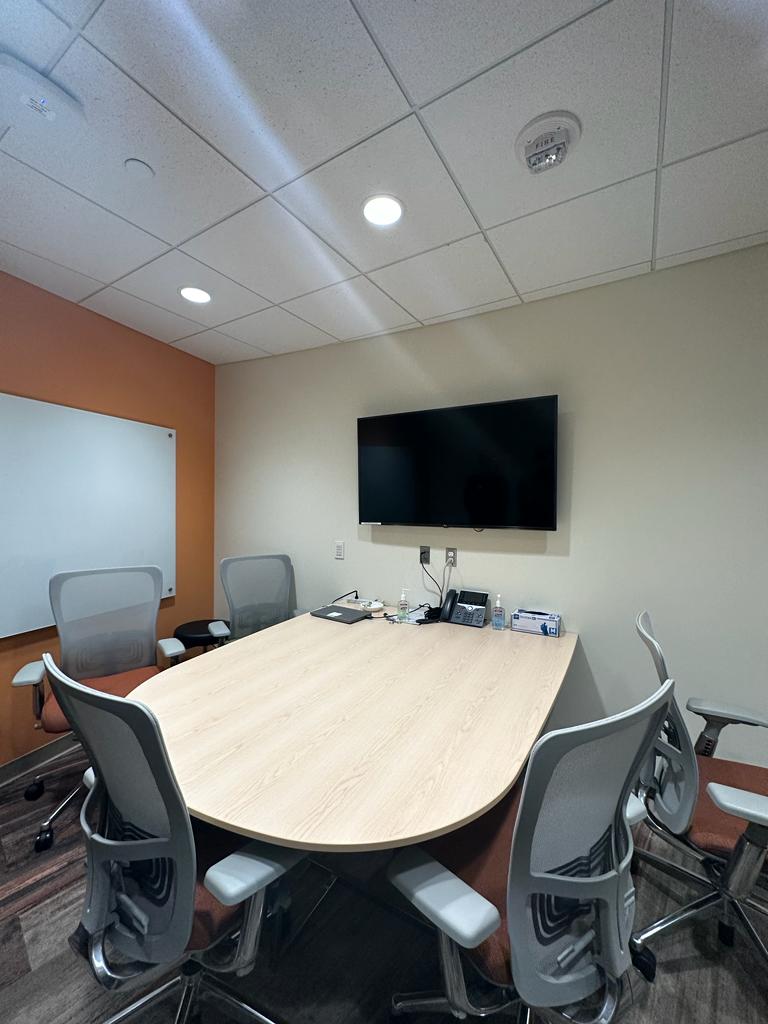
Debriefing Room
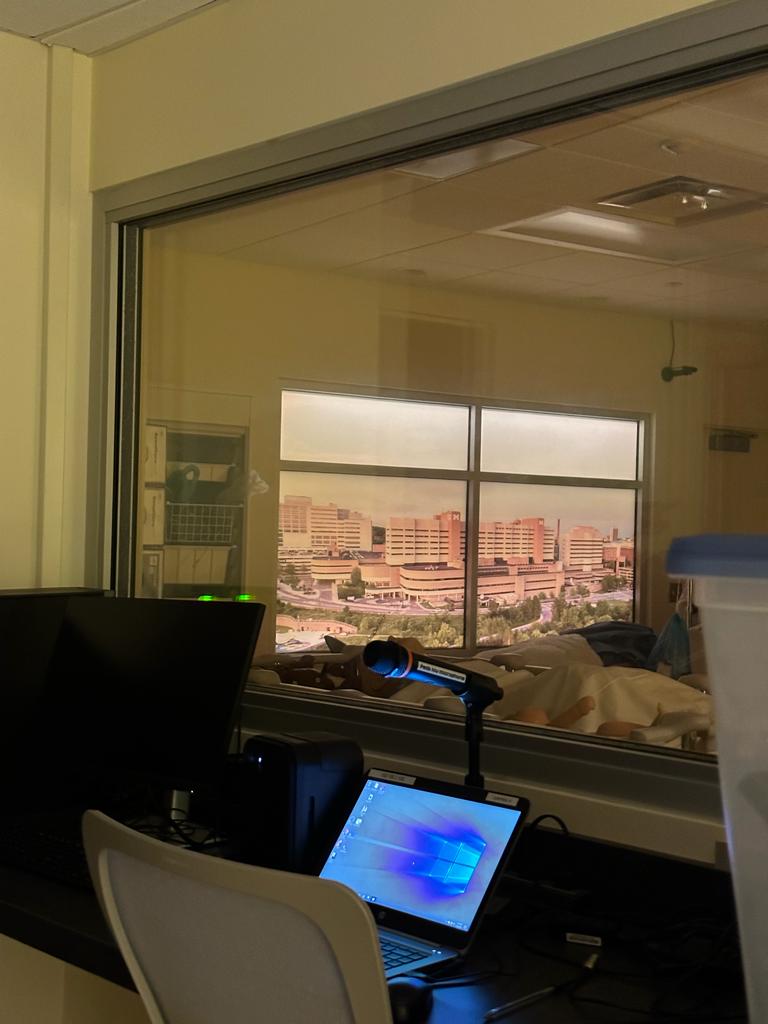
Observation Room (for instructors)
Simulation Room
Debriefing Room
Observation Room (for instructors)
Simulation Room
Debriefing Room
Observation Room (for instructors)
Simulation Room
Debriefing Room
Observation Room (for instructors)
Simulation Room
Debriefing Room
Observation Room (for instructors)
Simulation Room
Debriefing Room
Observation Room (for instructors)
Simulation Room
Debriefing Room
Observation Room (for instructors)
Simulation Room
Debriefing Room
Observation Room (for instructors)
The Solution
The Solution

Creating medical leaders, one debrief at a time.
We aim to transform debriefing data into personalized learning insights to enhance the development trajectory and lifesaving skills of each medical trainee in an efficient, scalable manner.
We aim to transform debriefing data into personalized learning insights to enhance the development trajectory and lifesaving skills of each medical trainee in an efficient, scalable manner.
We aim to transform debriefing data into personalized learning insights to enhance the development trajectory and lifesaving skills of each medical trainee in an efficient, scalable manner.
Target Audience
Target Audience
Instructors
Instructors
Keep a record of all trainees' performances and review student feedback.
Keep a record of all trainees' performances and review student feedback.
Trainees
Trainees
Keep a record of their performances to go back and learn from their mistakes.
Keep a record of their performances to go back and learn from their mistakes.
Interview Findings
Interview Findings

Instructor Says...
“It is important to tailor the feedback system to our specific learner population and personas. “

Trainee Says...
“Sometimes it’s almost too much training and there tends to be more questions than there is time to ask them. “

Student Says...
“Timeframes are frequently referenced, underpinning the narrative's context. “
Instructor Says...
“It is important to tailor the feedback system to our specific learner population and personas. “
Trainee Says...
“Sometimes it’s almost too much training and there tends to be more questions than there is time to ask them. “
Student Says...
“Timeframes are frequently referenced, underpinning the narrative's context. “
Ideation & Design
Ideation & Design
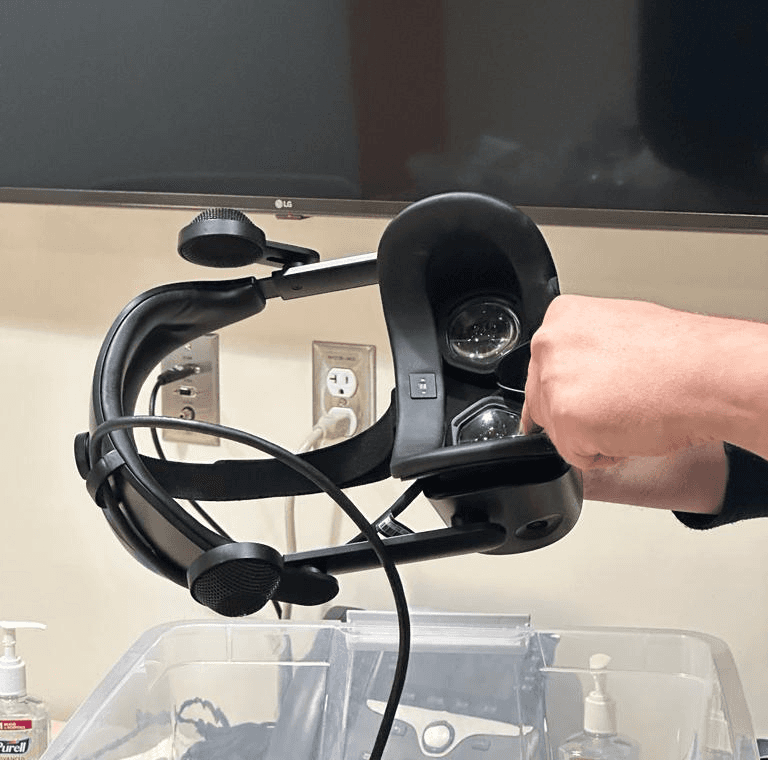
The simulation takes place in VR. This is the headset that trainees wear during the session.
The simulation takes place in VR. This is the headset that trainees wear during the session.
We brainstormed nine tools with an emphasis on performance metrics. Our efforts encompassed a range of methods, including discussion forums, VR playbacks, emailed performance reports, and dashboard designs.
We brainstormed nine tools with an emphasis on performance metrics. Our efforts encompassed a range of methods, including discussion forums, VR playbacks, emailed performance reports, and dashboard designs.

Methods Used
Methods Used
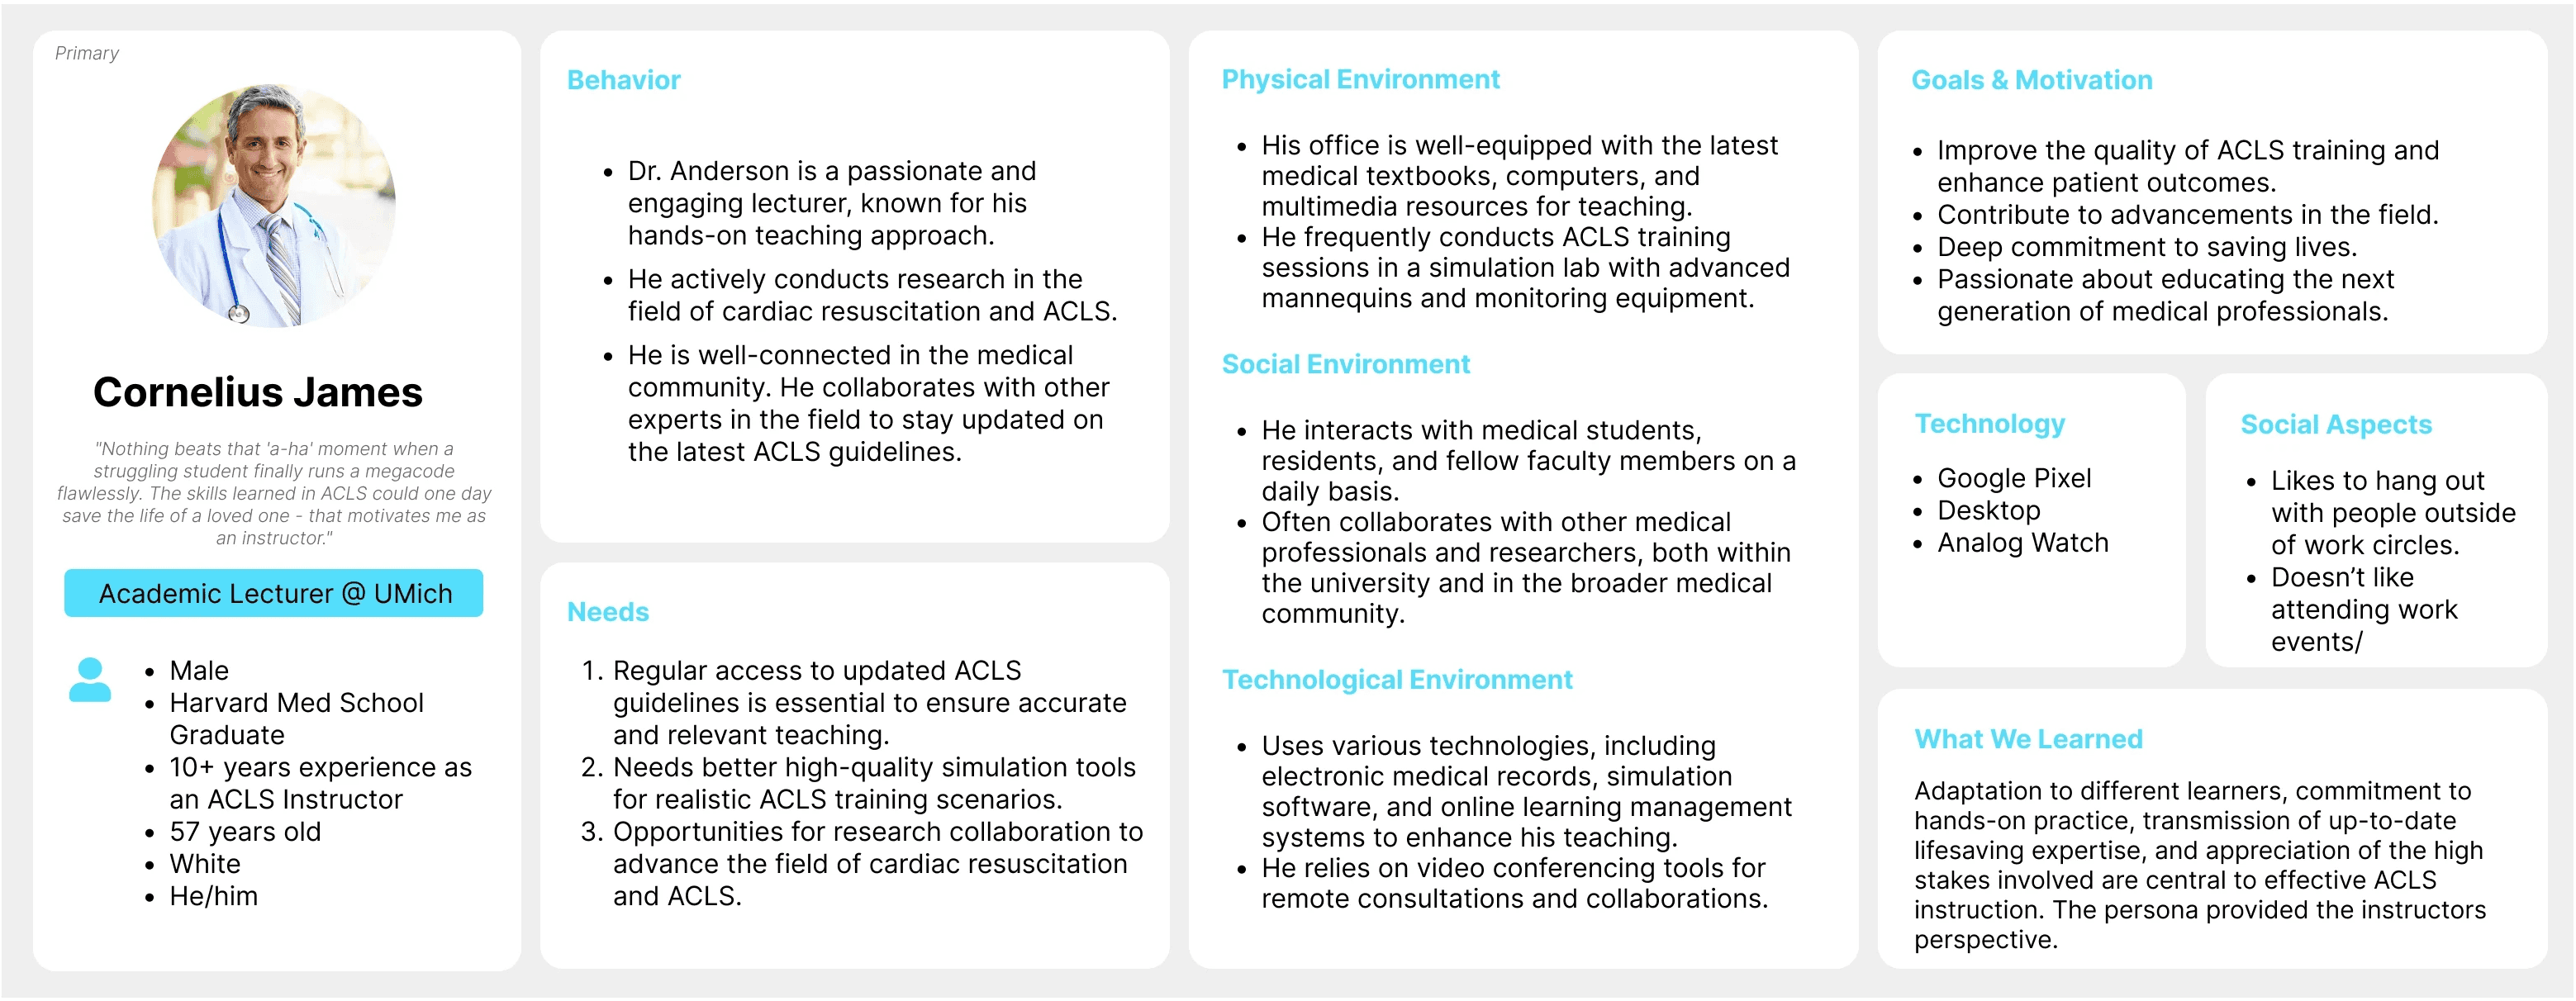
Personas
We created two primary and two secondary personas: medical students and instructors.
Creating personas helped us empathize with our users and see the problem from their perspective. It also helped us generate ideas and solutions that were tailored to their needs and goals.


QOC(Questions, Options, Criteria)
We created two primary and two secondary personas: medical students and instructors.
Creating personas helped us empathize with our users and see the problem from their perspective. It also helped us generate ideas and solutions that were tailored to their needs and goals.
Experience Journey Map & Story Map
We created two primary and two secondary personas: medical students and instructors.
Creating personas helped us empathize with our users and see the problem from their perspective. It also helped us generate ideas and solutions that were tailored to their needs and goals.
User Flow Diagram
We created two primary and two secondary personas: medical students and instructors.
Creating personas helped us empathize with our users and see the problem from their perspective. It also helped us generate ideas and solutions that were tailored to their needs and goals.
Low - Fidelity Prototype
Low - Fidelity Prototype
The low-fidelity prototype helped us test user navigation and core functionality, revealing key insights and unmet needs.
The low-fidelity prototype helped us test user navigation and core functionality, revealing key insights and unmet needs.

Video Playback

Instructor View Dashboard

Leaderboard

Debrief Session Selector Pop-up
Video Playback
Instructor View Dashboard
Leaderboard
Debrief Session Selector Pop-up
Video Playback
Instructor View Dashboard
Leaderboard
Debrief Session Selector Pop-up
Video Playback
Instructor View Dashboard
Leaderboard
Debrief Session Selector Pop-up
Mid - Fidelity Prototype
Mid - Fidelity Prototype
We gained key insights from the usability tests which ultimately helped us refine our design and remove any irrelevant details.
We gained key insights from the usability tests which ultimately helped us refine our design and remove any irrelevant details.
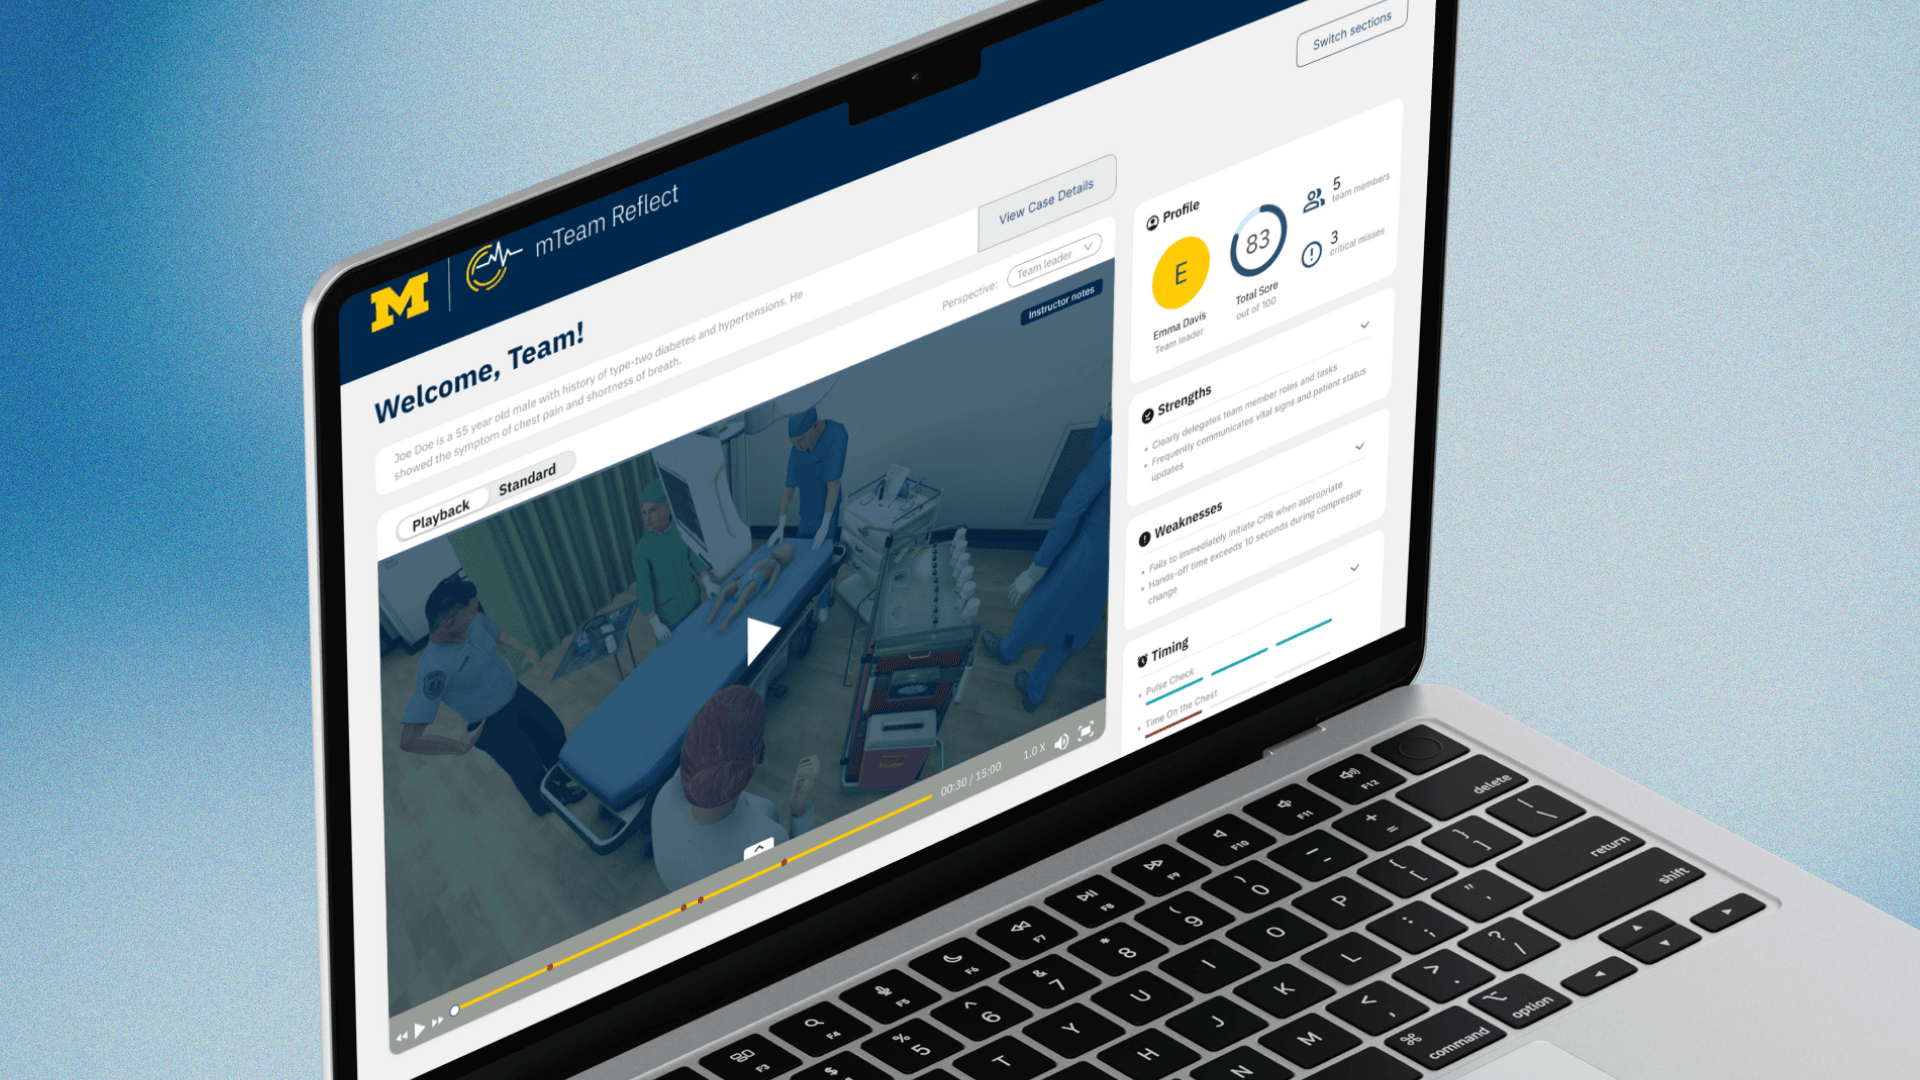
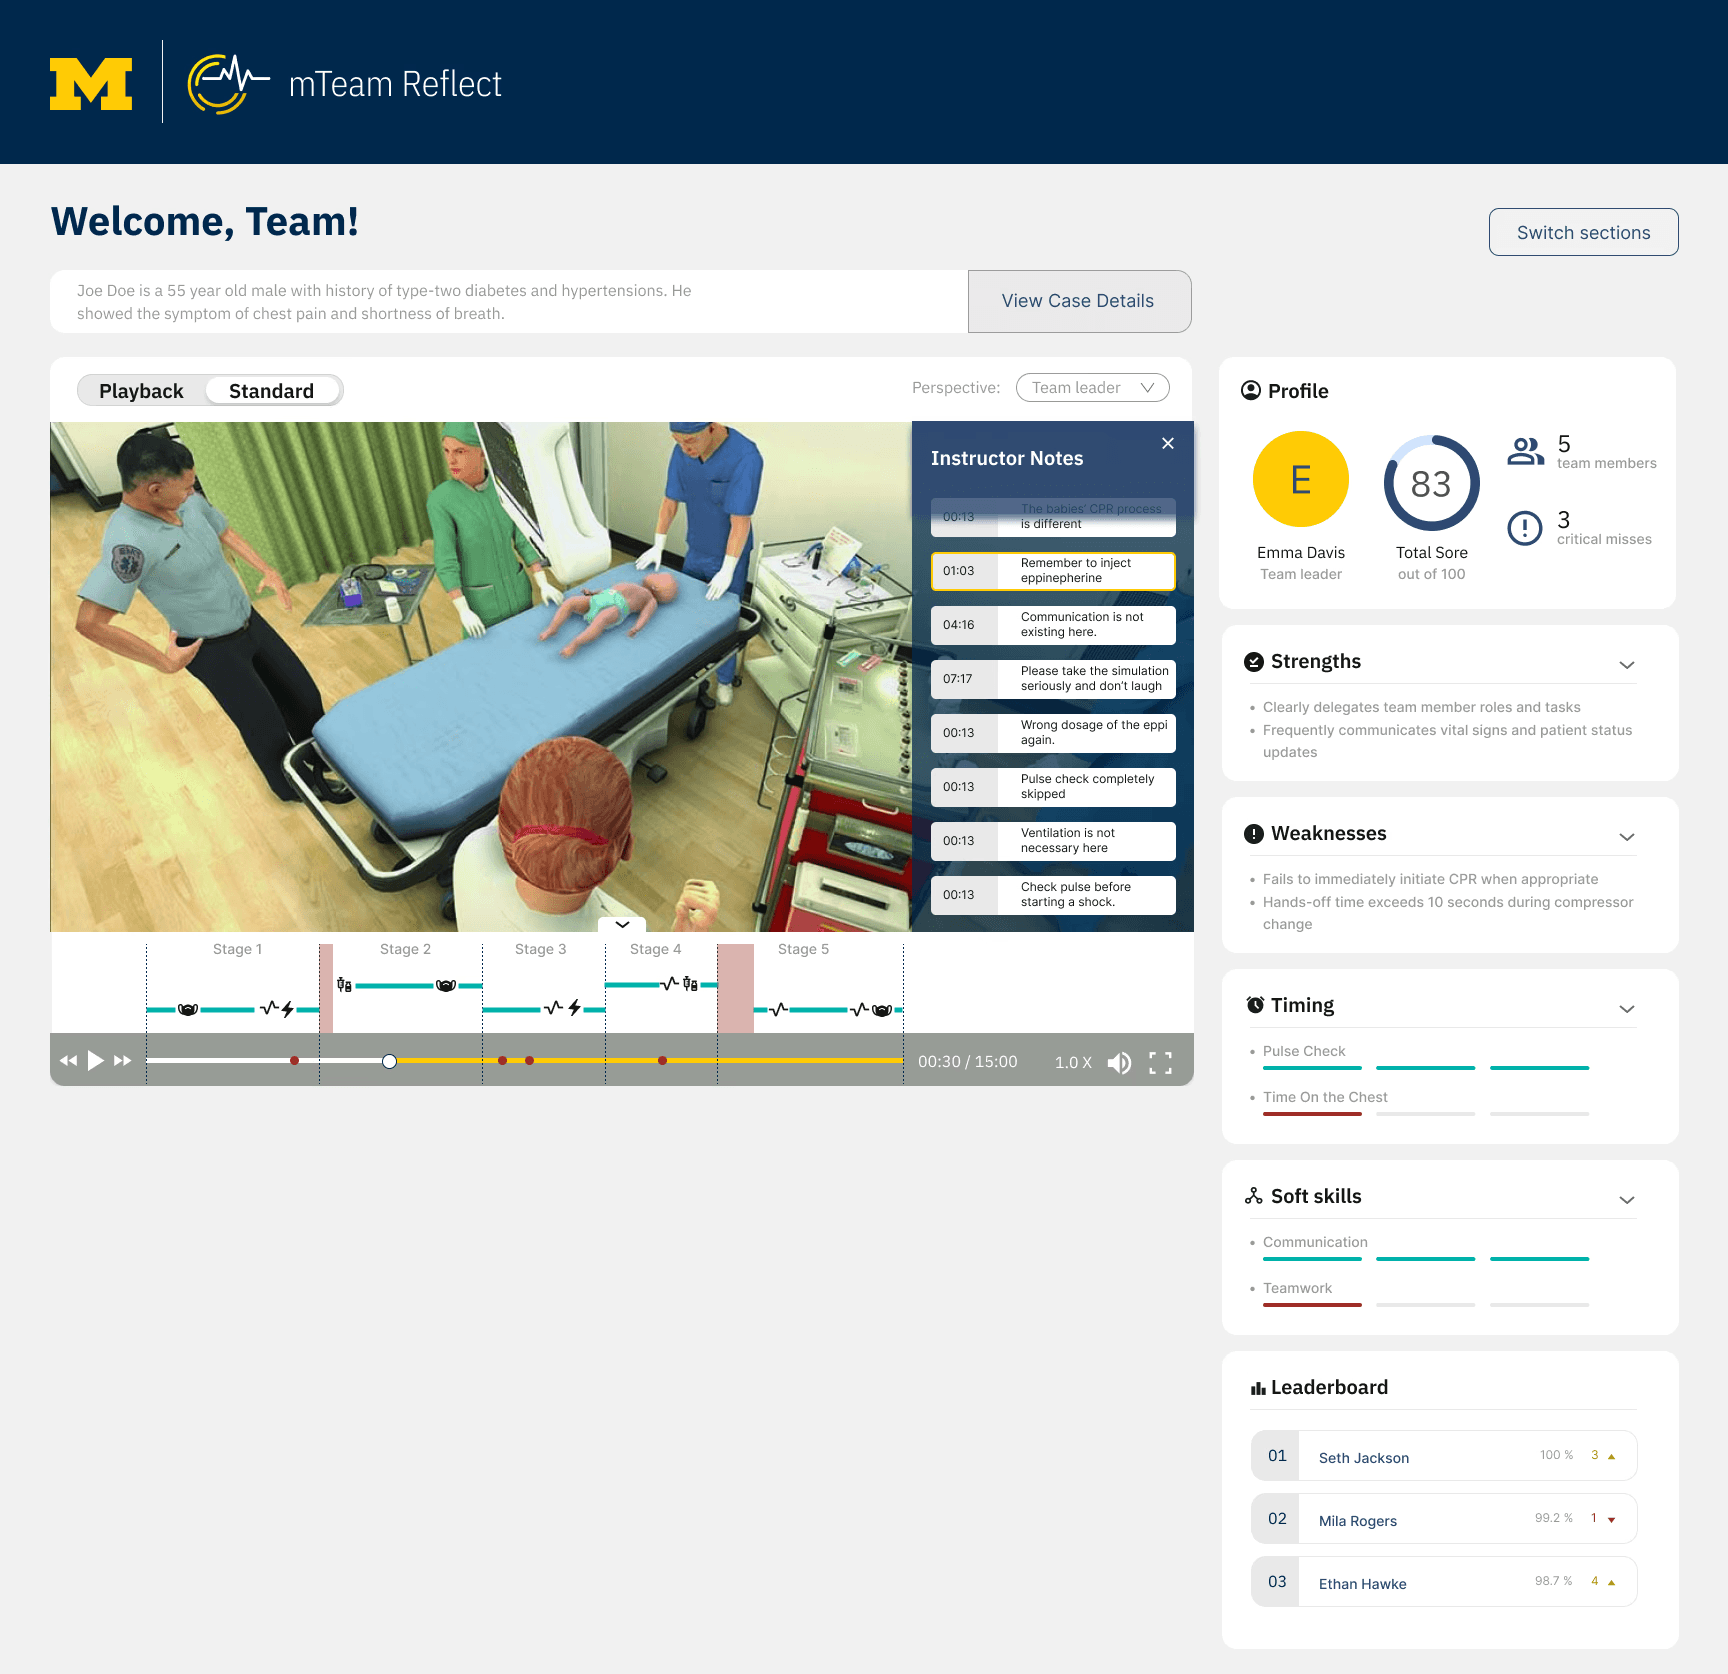
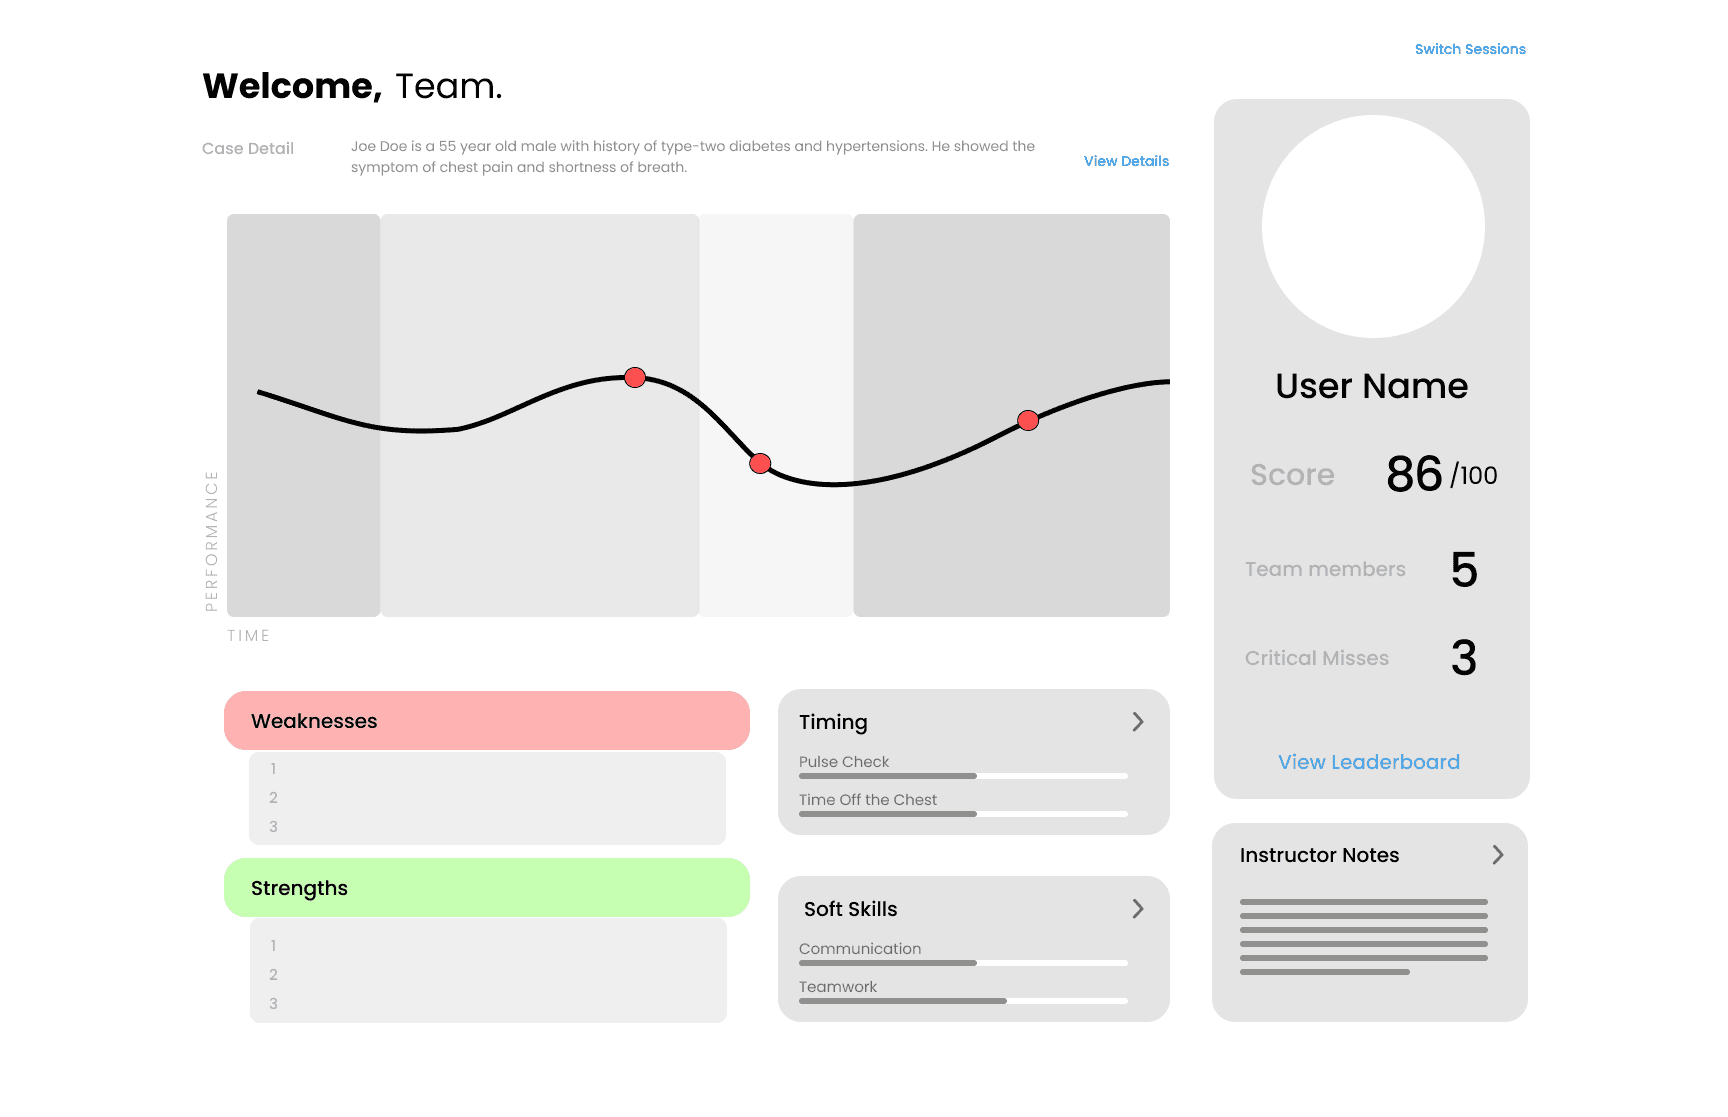
Given the quick debrief sessions, the dashboard prioritizes video playback and standard comparisons.
Given the quick debrief sessions, the dashboard prioritizes video playback and standard comparisons.
Given the quick debrief sessions, the dashboard prioritizes video playback and standard comparisons.
The new design makes the dashboard easily scannable.
The new design makes the dashboard easily scannable.
The new design makes the dashboard easily scannable.
Performance metrics appear in a scrollable, collapsible right panel.
Performance metrics appear in a scrollable, collapsible right panel.
Performance metrics appear in a scrollable, collapsible right panel.
Use the slider to compare the low-fidelity and mid-fidelity designs.

Action Timeline with Instructor Comments
The video timeline includes timestamped instructor comments and red dots marking critical trainee mistakes. Standard stage times appear as vertical dashed lines, while actual timings are shown with blue lines. Red rectangles highlight delays. Icons represent simulation actions, and users can hover to view their meanings, making the interface intuitive and informative.
The video timeline includes timestamped instructor comments and red dots marking critical trainee mistakes. Standard stage times appear as vertical dashed lines, while actual timings are shown with blue lines. Red rectangles highlight delays. Icons represent simulation actions, and users can hover to view their meanings, making the interface intuitive and informative.

Summary Dashboard
As instructors have multiple teams, this dashboard allows them to dive into team - specific data with more gradual detail
As instructors have multiple teams, this dashboard allows them to dive into team - specific data with more gradual detail
Prototype Walkthrough
This video highlights the walkthrough of all three stages of our product.
This video highlights the walkthrough of all three stages of our product.
Branding
For the branding, we followed all guidelines of Michigan Medicine to ensure it follows their identity and blends in with their aesthetic.
For the branding, we followed all guidelines of Michigan Medicine to ensure it follows their identity and blends in with their aesthetic.

Aa
Aa
IBM Plex Sans
ABCDEFGHIJKLMNOPQRSTUVWXYZ
012345
00274C
576E9A
DAEDFA
FFCB05
E9E9E9
989C97
Learning Outcomes
Learning Outcomes
🗣️ User Research & Persona Development
🗣️ User Research & Persona Development
Led user interviews with trainees and instructors to identify key pain points and build actionable personas based on real needs.
Led user interviews with trainees and instructors to identify key pain points and build actionable personas based on real needs.
🧩 UX Strategy & Design Foundations
🧩 UX Strategy & Design Foundations
Explored QOC as a new method and found it highly effective in evaluating design options and guiding user-centered decisions.
Explored QOC as a new method and found it highly effective in evaluating design options and guiding user-centered decisions.